This post will show you an extremely simple way to make quick-and-dirty Bokeh plots from data you’ve generated in Spark, but the basic technique is generally applicable to any data that you’re generating in some application that doesn’t necessarily link in the Bokeh libraries.
Getting started
We’ll need to have a recent version of Bokeh installed and some place to put our data. If you don’t already have Bokeh installed, use virtualenv to get it set up:
virtualenv ~/.bokeh-venv
source ~/.bokeh-venv/bin/activate
pip install bokeh numpy pandas
This will download and build a nontrivial percentage of the Internet. Consider getting some coffee or catching up with a colleague while it does its thing.
The next thing we’ll need is some place to stash data we’ve generated. I’ll use a very simple service that I developed just for this kind of application, but you can use whatever you want as long as it will let you store and retrieve JSON data from a given URL.
With all that in place, we’re ready to make a simple plot.
A basic static-HTML plot
We’re going to use Bokeh to construct a basic line graph in a static HTML file. The catch is that instead of specifying the data statically, we’re going to specify it as a URL, which the page will poll so it can update the plot when it changes. Here’s what a script to construct that kind of plot looks like:
#!/usr/bin/env python

from bokeh.plotting import figure, output_file, show
from bokeh.models.sources import AjaxDataSource
output_file("json.html", title="data polling example")
source = AjaxDataSource(data_url="http://localhost:4091/tag/foo", polling_interval=1000)
p = figure()
p.line('x', 'y', source=source)
show(p)
Note that the above example assumes you’re using the Firkin service as your data store. If you’re using something else, you will probably need to change the data_url parameter to the AjaxDataSource constructor.
Publishing and updating data
Now we’ll fire up the Firkin server and post some data. From a checkout of the Firkin code, run sbt server/console and then create a connection to the server using the client library:
val client = new com.freevariable.firkin.Client("localhost", 4091)You can now supply some values for x and y. We’ll start simple:
/* publish an object to http://localhost:4091/tag/foo */
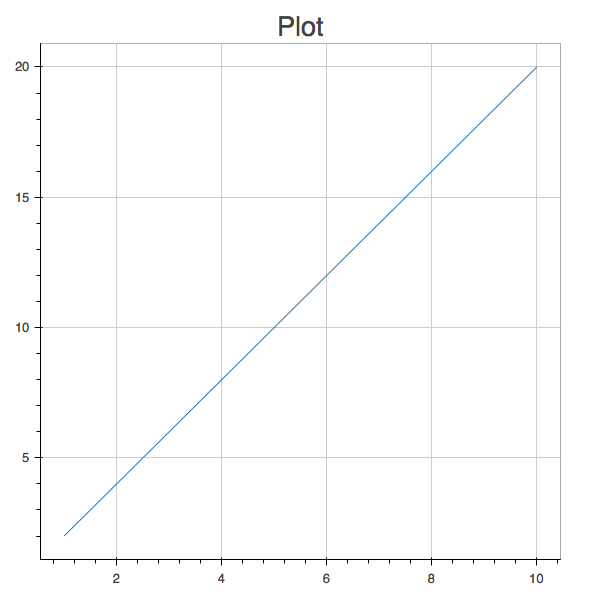
client.publish("foo", """{"x": [1,2,3,4,5,6,7,8,9,10], "y": [2,4,6,8,10,12,14,16,18,20]}""")
If you don’t already have json.html from the previous step loaded in your browser, fire it up. You should see a plot that looks like this:

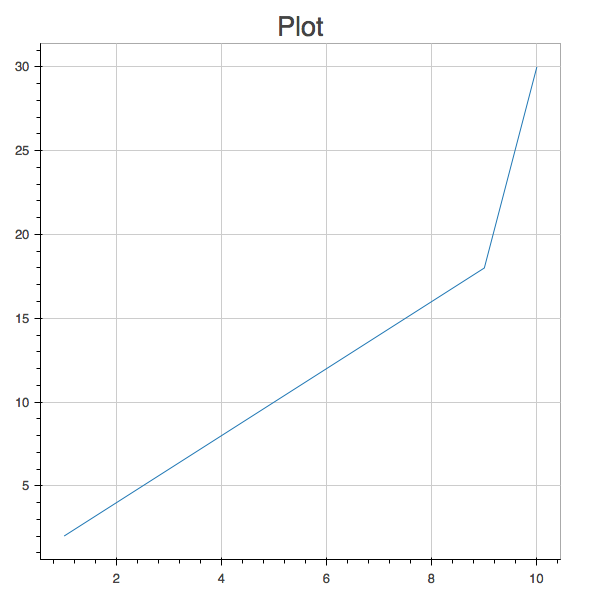
If we update the data stored at this URL, the plot will update automatically. Try it out; publish a new data set:
client.publish("foo", """{"x": [1,2,3,4,5,6,7,8,9,10], "y": [2,4,6,8,10,12,14,16,18,30]}""")The plot will refresh, reflecting the updated y value:

(Again, if you’re using some other JSON object cache to store your data sets, the principles will be the same but the syntax won’t be.)
Connecting Bokeh to Spark
Once we have a sink for JSON data, it’s straightforward to publish data to it from Spark code. Here’s a simple example, using json4s to serialize the RDDs:
import org.json4s.JsonDSL._
import org.json4s.jackson.JsonMethods._

// assume that spark is a SparkContext object, declared elsewhere
val x = spark.parallelize(1 to 100)
// x: org.apache.spark.rdd.RDD[Int] = ParallelCollectionRDD[0] at parallelize at <console>

val y = x.map(_ / 4)
y: org.apache.spark.rdd.RDD[Int] = MapPartitionsRDD[1] at map at <console>

val json = ("x" -> x.collect.toList) ~ ("y" -> y.collect.toList)

val client = new com.freevariable.firkin.Client("localhost", 4091)

client.publish("data", compact(render(json)))
After we do this, the data will be available at http://localhost:4091/tag/data.
Alternate approaches
The approach described so far in this post was designed to provide the simplest possible way to make a basic plot backed by a relatively small amount of dynamic data. (If we have data to plot that we can’t store in memory on a single node, we’ll need something more sophisticated.) It is suitable for prototyping or internal use. Other approaches, like the two below, might make more sense for other situations:
- Bokeh offers several alternate language bindings, including one for Scala. This means that you can define plots and supply data for them from within applications that link these libraries in. This is the approach that spark-notebook takes, for example.
- Another possibility is setting up the Bokeh server and publishing plots and data to it. The Bokeh server offers several additional capabilities, including support for scalable visualizations (e.g., via sampling large datasets) and support for multiple authenticated users.