Self-organizing maps are a useful technique for identifying structure in high-dimensional data sets. The map itself is a low-dimensional arrangement of cells, where each cell is an object comparable to the objects in the training set. The goal of self-organizing map training is to arrange a grid of cells so that nearby cells will be the best matches for similar objects. Once we’ve built up the map, we can identify clusters of similar objects (based on the cells that they map to) and even detect outliers (based on the distributions of map quality).
Here are a few snapshots of the training process on color data, which I developed as a test for a parallel implementation of self-organizing maps in Apache Spark. For this demo, I used angular similarity in the RGB color space (not Euclidean distance) as a measure of color similarity. This means that, for example, a darker color would be considered similar to a lighter color with a similar hue.
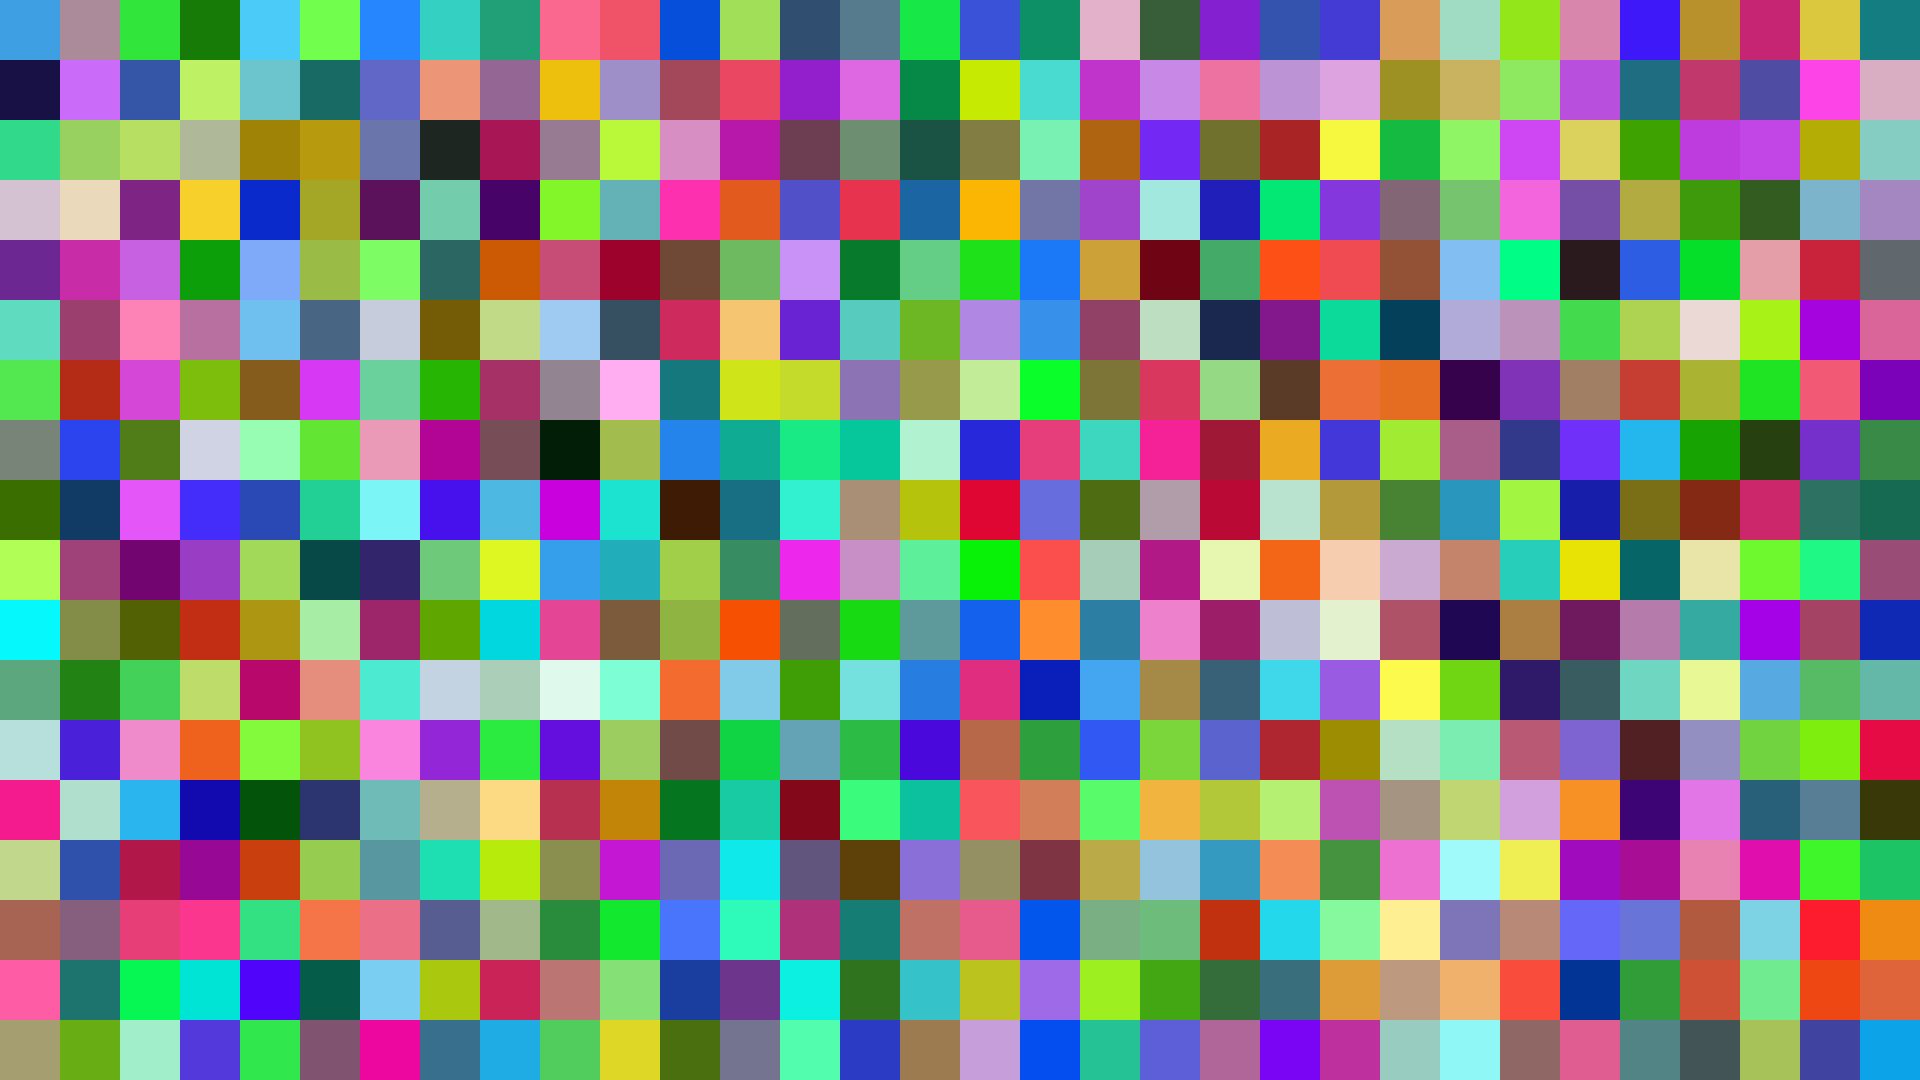
We start with a random map:
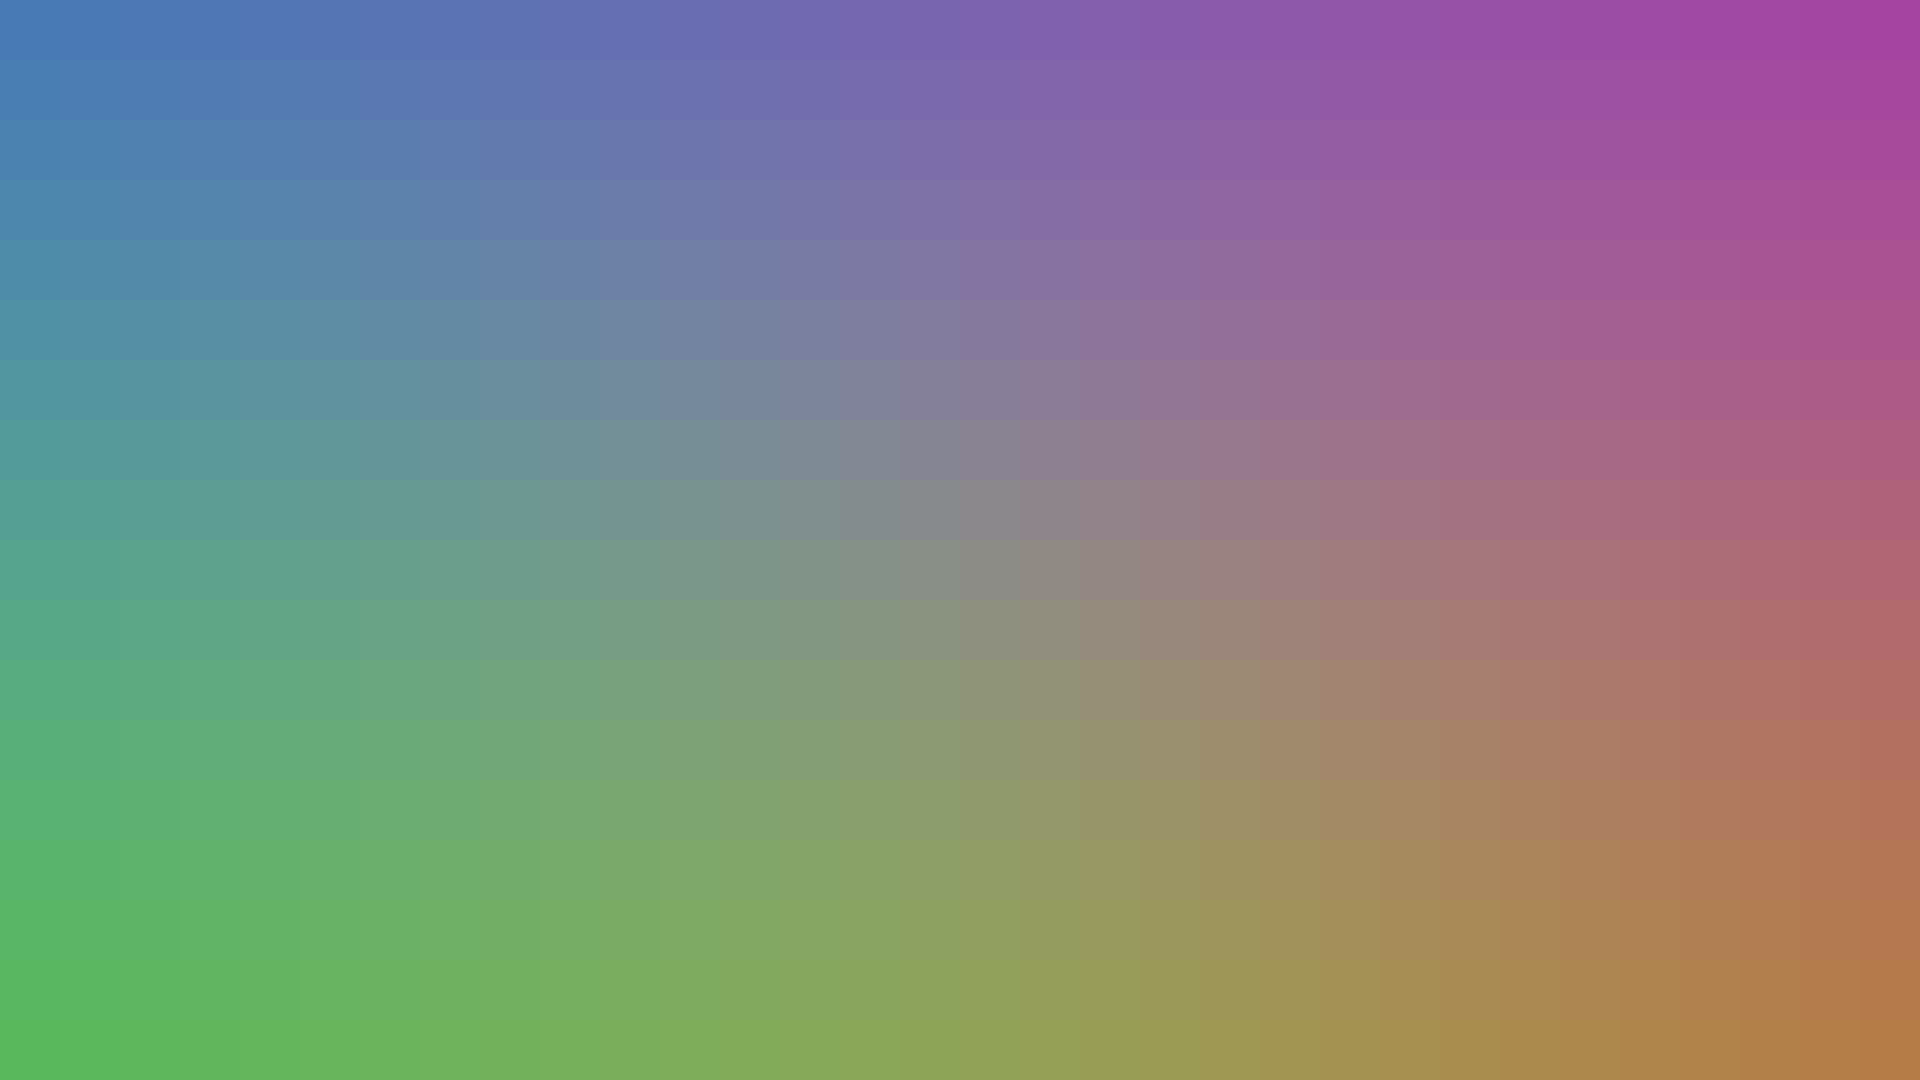
Matches made in the first training iteration essentially affect the whole map, producing a blurred, unsaturated, undifferentiated map:

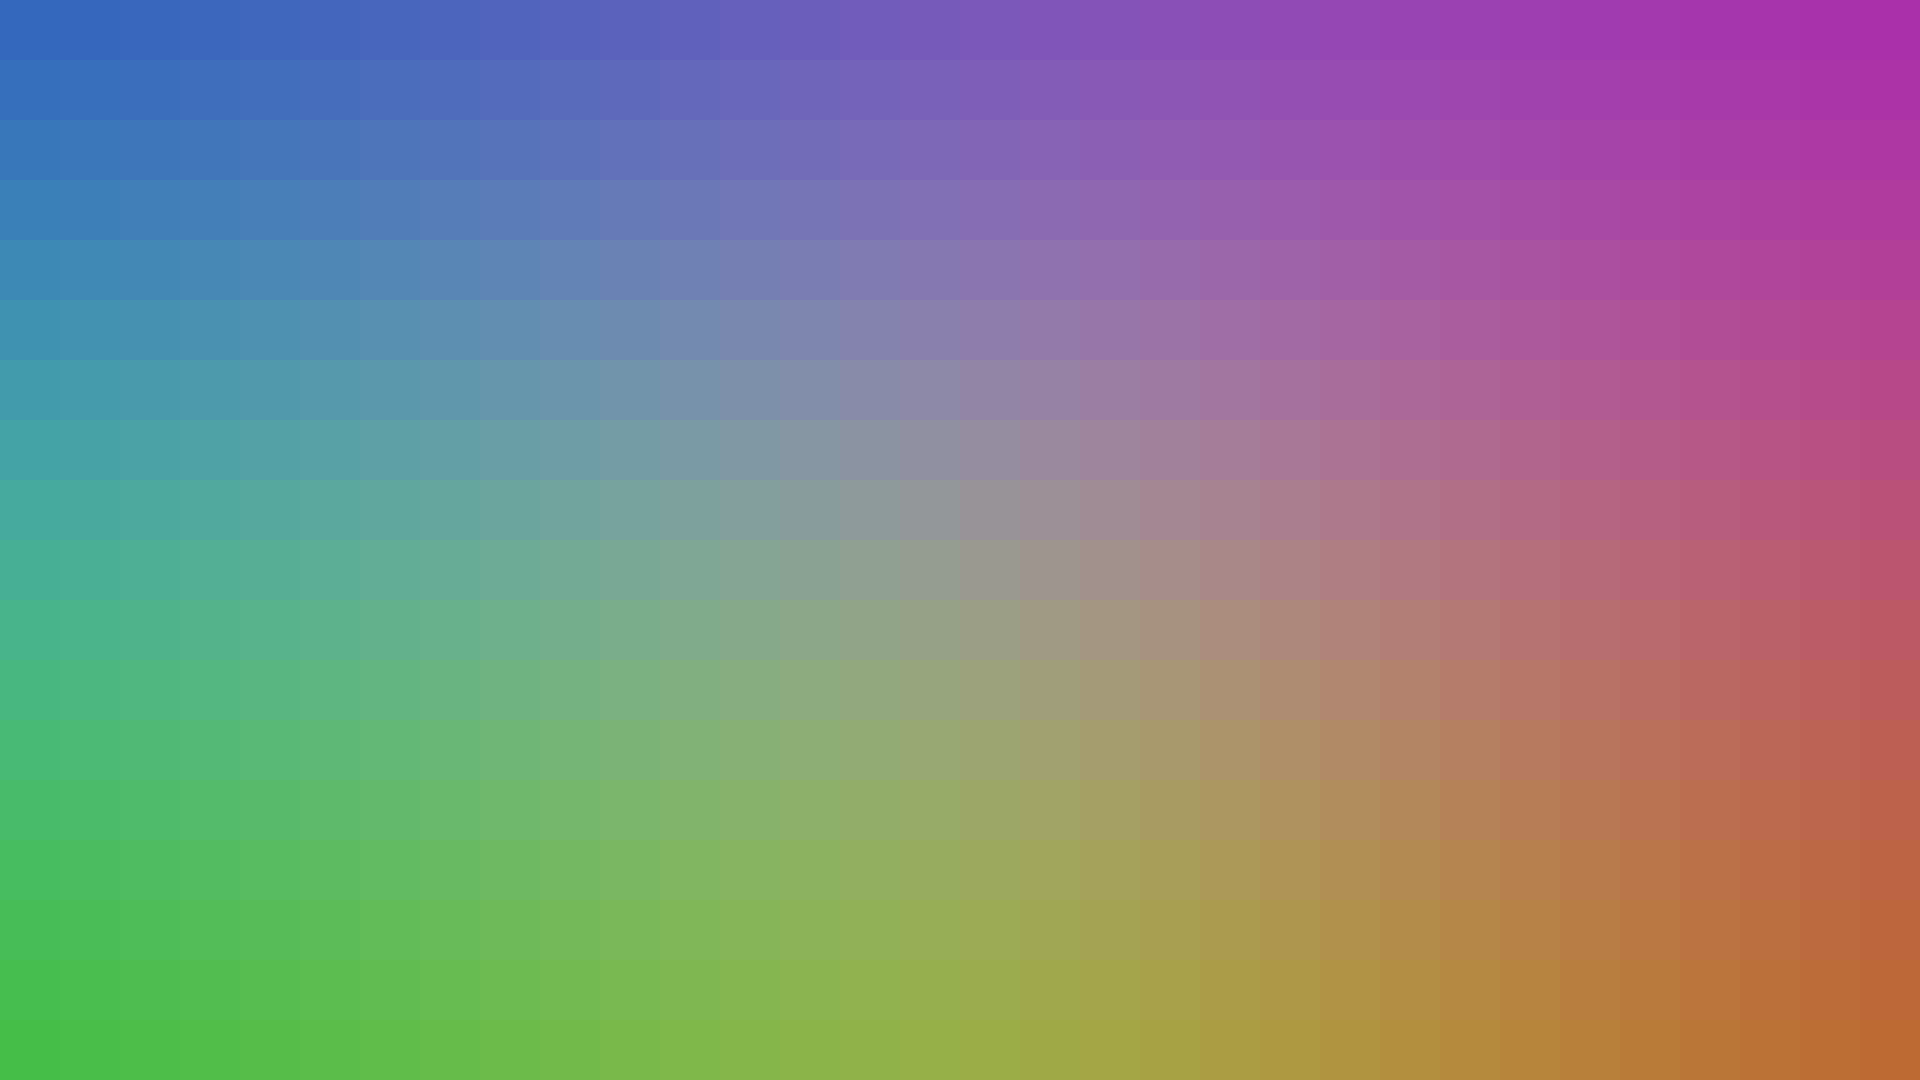
Some structure begins to emerge pretty rapidly, though; after one quarter of our training iterations, we can already see clear clusters of colors:
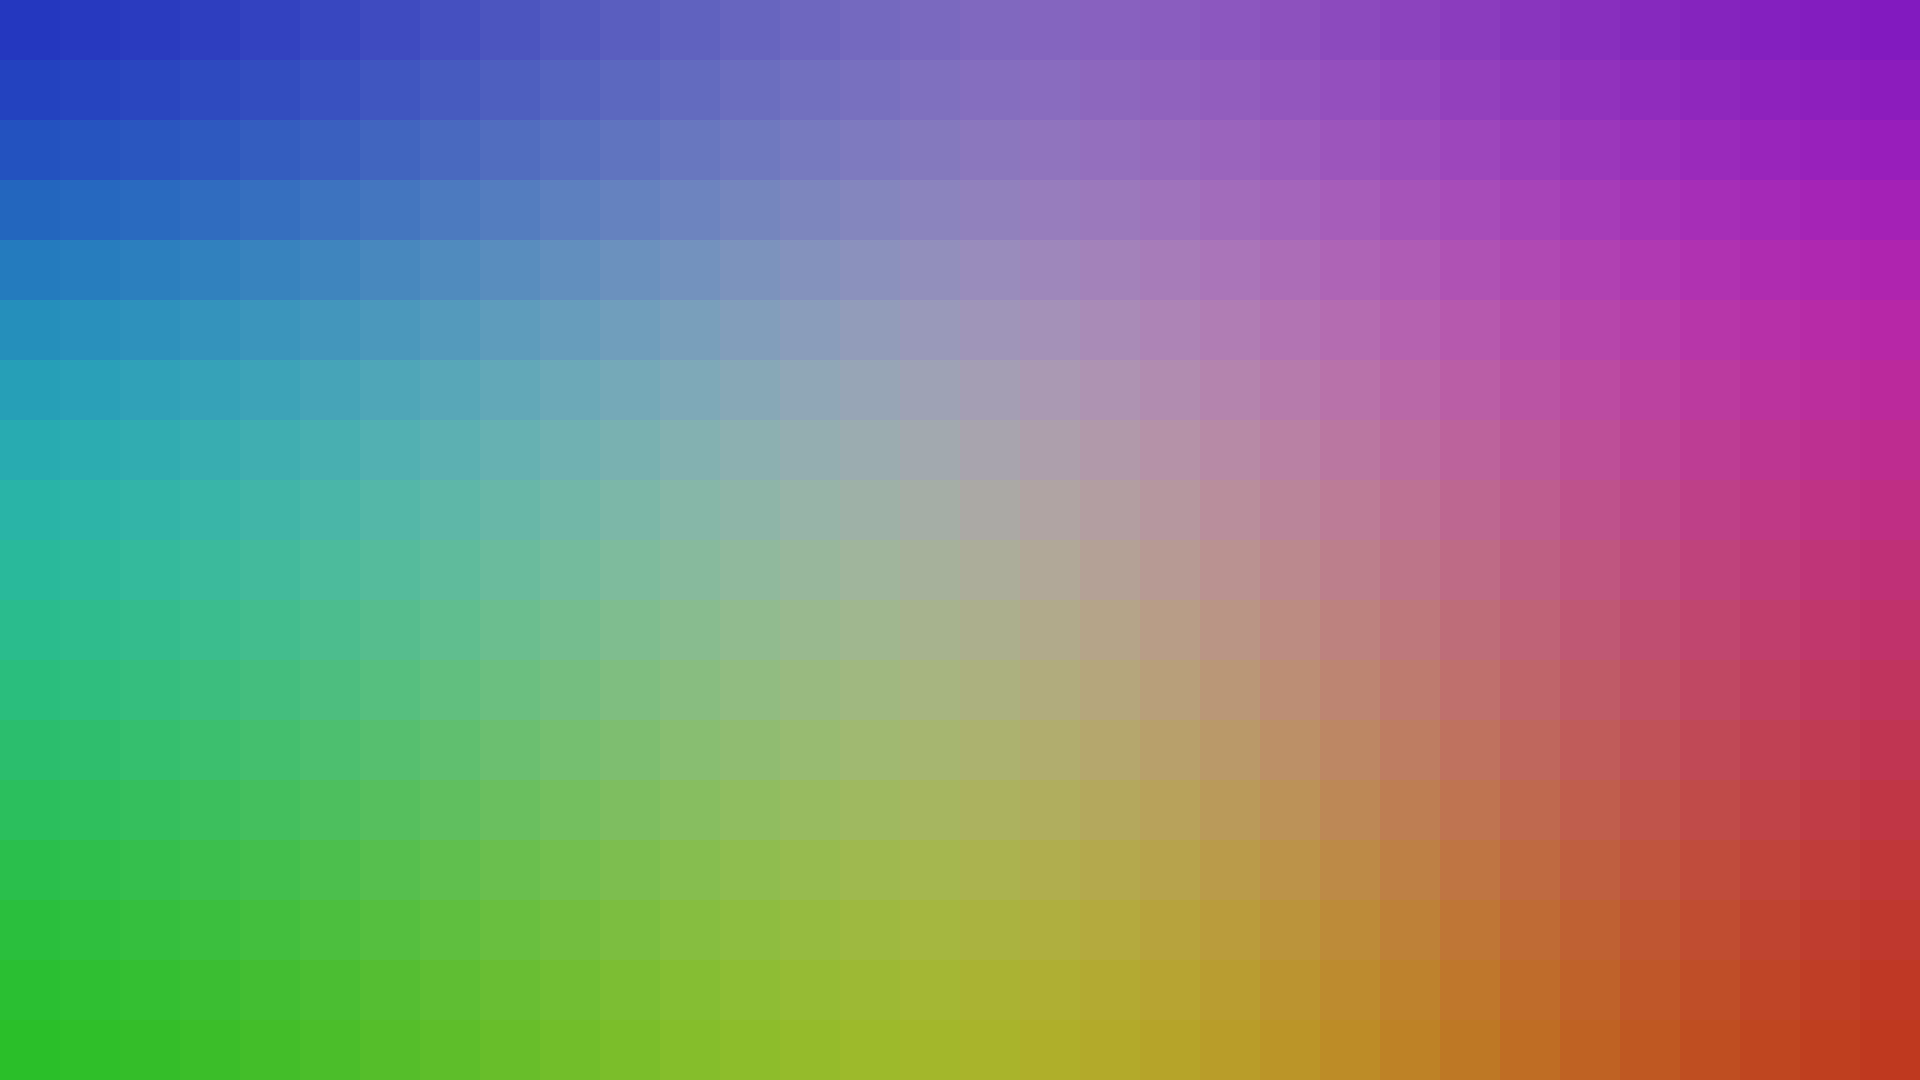
The map begins to get more and more saturated as similar colors are grouped together. Here’s what it looks like after half of the training iterations:
…and three-quarters of the training iterations:
As training proceeds, it gradually affects smaller and smaller neighborhoods of the map until the very end, when each training match only affects a single cell (and thus the impact of darker colors becomes apparent, since they can cluster together in single cells that are not the best matching unit for any brighter colors):

In a future post, I’ll cover the training algorithm, introduce the code, and provide some tips for implementing similar techniques in Spark. For now, though, here is a demo video that shows an animation of the whole map training process: